

IPO Market Gained Strength in 2025
IPO Market Gained Strength in 2025
In 2025, the initial public offering (IPO) market continued to rebound from the 2022 and 2023 slump. For the second year in a row, markets saw more IPOs, more special purpose acquisition companies (SPACs), and more capital raised at IPO.
Looking at the data, we see IPOs really gained strength toward the end of the year — IPOs raised more money, and SPACs rebounded to almost 2020 levels.
2025 IPOs increase for third straight year
Using data from Jay Ritter, a well-known IPO academic with a long history of activity, we look at historic IPOs of U.S. companies.
Ritters’ data excludes exchanged-traded funds. It also allows us to separate companies that had an IPO price under $5, SPACs, banks, unit offers, partnerships, trusts, and REITS in a separate “other” category (below).
Chart 1: IPOs continued to rise in 2025

In 2025, we saw a total of 354 U.S. equity market IPOs — that’s 136 more than in 2024 and 206 more than in 2023, but still well below 2021’s high. Although operating company IPOs are still not back to levels seen in the latter half of the 2010s.
2025 IPOs raised $44 billion
Capital raising continued to increase in 2025, with (non-SPAC) IPOs raising a total of $44 billion; $14 billion more than in 2024 and $24 billion more than in 2023. Capital raised in 2025 even surpassed the total raised between 2015 – 2018.
Notably, 81% of new IPOs chose Nasdaq for their listings home, raising a total of $25 billion on IPO day.
Chart 2: Capital raised in IPOs increases

Industrials and Tech companies dominated 2025 IPOs
With the AI boom, it’s no surprise that Information Technology (IT) companies made up over 25% of 2025 (non-SPAC) IPOs. Together, IT and Industrials companies were over half of 2025 IPOs.
Notable names include:
- CoreWeave, Inc. (CRWV), which raised $1.5 billion and reached a day-one market cap of $18.6 billion.
- SailPoint, Inc. (SAIL), which raised $1.38 billion and reached a day-one market cap of $12.2 billion.
- Firefly Aerospace, Inc. (FLY), which raised $998.6 million and reached a day-one market cap of $8.5 billion.
But the winner for most raised at IPO in 2025 was health care company Medline, Inc. (MDLN), raising $6.26 billion in their IPO.
Chart 3: Tech and Industrials made up over half of 2025 IPOs

Day-one returns continued their positive trend
Day-one return, or IPO pop, measures the return on the stock from the institutional placement price to close on the stock’s first day of trading.
In 2025, we saw a slight improvement to 2024 one-day IPO return – and back closer to long term averages. Specifically:
- Median IPO pop was 13%, and average IPO pop was 22%.
- 71% of companies had a positive pop.
Chart 4: IPO first-day returns distribution

Good IPO pop faded more than normal
We also see that the longer 2025 IPOs were listed, the more their “pop” faded (the green line in Chart 5).
Despite the fade in median 2025 IPO’s performance - longer-term median returns have held up better than for 2024 (pink line) and 2023 (dark blue line) IPOs. Interestingly, the 6-month average return is the second-best at 36%; however, this excludes IPOs after June since they aren’t old enough yet.
Chart 5: 2025 IPOs performed better in the long run than the last three years

Unicorns were less special in 2025
The data in Chart 6 shows returns through end of year 2025 by day-one market cap. The bubbles are sized by how much capital the company raised.
In 2024, we saw a strong size-bias to returns – where unicorns were much more likely to have positive returns than smaller companies. In 2025, that trend mostly disappeared. Through year-end, the:
- Cap-weighted return, using year-end market cap, was 6.5%, while
- The overall median return was 1.29%.
Chart 6: 2025 IPOs returns through end of year

Looking at the IPOs by sector (circle colors):
- Health Care stocks fared the best with an average return of 39% through Dec. 31, 2025.
- Consumer Staples also fared well, but recall Chart 3, there was only one Consumer Staples IPO, SFD. Through Dec. 31, 2025, the lone sector IPO returned 13%.
- The Energy sector fared the worst with an average drop of 38.5% through Dec. 31, 2025.
- Information Technology had the most IPOs with the largest cumulative raise ($11.2 billion). Although, by year end, the sector’s IPOs had an average return of -33%.
Looking across the horizontal axis, we also see different demand for capital across sectors:
- The two largest IPOs were MDLN, reaching a day-one market cap of $54 billion, and CRWV, with a day-one market cap of $18.6 billion (although both raised a fraction of that value).
- The Health Care sector wasn’t far behind IT, raising $10.6 billion at IPO between 34 companies.
- Industrials raised only $5 billion, even though the sector had 53 IPOs, showing Industrials companies have about half the demand for capital compared to Health Care companies.
SPAC recovery: by count and size
We saw a recovery in SPACs, too, reaching their third-highest level in our records — right behind 2020 and 2021 — with 88 more SPACs listed than in 2024, and only 101 less SPACs than in 2020.
Right now, 120 of the 2025 SPACs are still actively looking for targets (orange), while 24 have already announced a deal (purple).
Remember, SPACs typically have about two years to find a deal, although they can seek shareholder approval to extend the SPAC’s life (usually up to another year). After that they are required to liquidate. To that end, looking at prior vintages of SPACs:
- All 2024 SPACs are also still active – at year end, eight had completed a deal (green), 26 have announced, and 22 are still active.
- Only two 2023 SPACS are still active, and two have liquidated (black), which makes sense as we enter 2026.
- 50% of SPACs from the peak listing year of 2021 were liquidated.
Chart 7: New SPAC listings almost tripled in 2025 compared to 2024

In 2025, many SPACs raised more capital than each of the prior three years. The median SPAC raised $200 million (grey box, Chart 8), only slightly less than $220 million in 2021, and mostly in line with 2016 – 2020.
Chart 8: More 2025 SPACS raised more capital than 2023 and 2024

SPAC prices stay around $10
Active SPACs that are still looking for a deal range in price range from $9.94 to $13.03 with an average price of $10.47 and a median price of $10.28.
SPACs that have announced a deal are slightly higher in price, but that’s mostly because of the strong performance of WLACU. The data in Chart 9 shows only a few SPACs that have announced a deal are trading above $11.
Chart 9: Active SPAC prices still held at around $10

2025 was a strong IPO market
Last year was one of the best years for IPOs (outside of 2020-2021) in the last decade. We saw more IPOs, more capital raised, more SPACs, and better day one returns in 2025.
Our IPO pulse predicts a continued strong IPO market into 2026. Counting just the “centicorns” – companies valued at $100 billion or more – the list of potential IPOs includes SpaceX (which recently acquired xAI), OpenAI, ByteDance, Anthropic AI, Databricks, and Stripe. Thanks largely to AI investments, Bloomberg suggests companies worth a combined $3 trillion could IPO in 2026.
In short, 2026 could be a historic year for IPOs!
Commandité
Commandité
Commandité
Commandité
Annonces
Catégories
Lire la suite
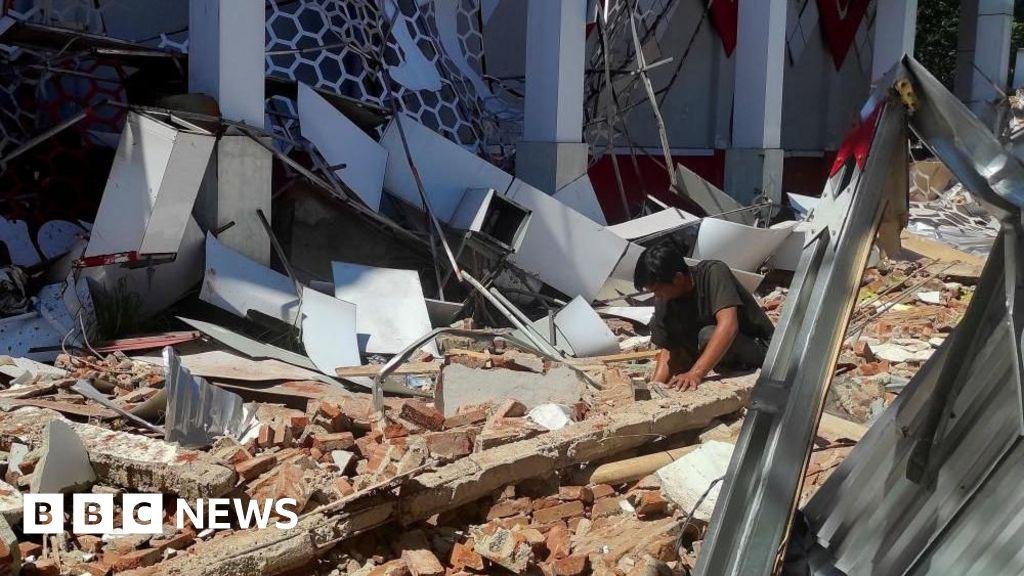
Indonesia earthquake: Magnitude 7.4 quake kills oneMagnitude 7.4 earthquake hits off Indonesia, killing one55 minutes agoAstudestra Ajengrastri,Jakarta,Abd Rahman Muchtar,ManadoandKelly NgReutersWhile the region sees high levels of seismic activity, some say this was one of the strongest quakes they've experienced in recent yearsA 7.4-magnitude earthquake struck in the Molucca Sea off...
Pakistan hosts diplomatic discussions on ending war In this photo released by the Pakistan Ministry of Foreign Affairs, Turkish Foreign Minister Hakan Fidan, center, walks toward his car upon arrival to attend a meeting in Islamabad, Pakistan, Saturday, March 28, 2026....
Supreme Court Declines Case on Granting Copyright to AI-Created ArtA legal battle over AI copyright that has gone on for more than a decade may have reached its end, with the US Supreme Court declining to hear a case involving AI-generated visual art.The subject of the case is an image created by computer scientist Stephen Thaler in 2012, titled "A Recent Entrance to Paradise," using an AI tool...
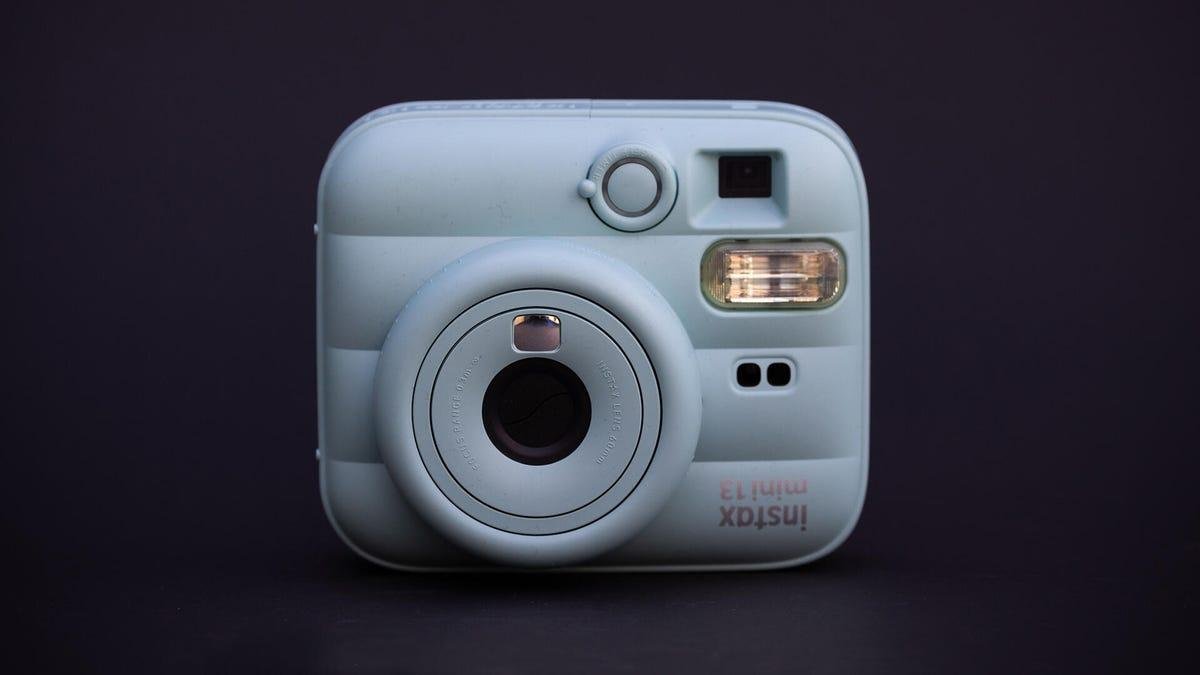
Fujifilm Instax Mini 13 Review: Instant Mini Analog Fujifilm Instax Mini 13 Pros Fun, pillowy design Instant physical photos Self-timer and flash Cons Easy to accidentally select Close-Up mode No wireless connectivity Bulky Fujifilm Instax...
Best Smart Soundbar of 2026 Our Experts Written by Ty Pendlebury Article updated on February 14, 2026 at 3:00 AM PST TV and home video editor Ty Pendlebury joined CNET Australia in 2006, and moved to New York City to be a part of CNET in 2011. He tests, reviews and writes about the latest TVs and audio equipment. When he's not playing...